
The podcast metrics that belong in a client report.
Most reporting disputes come down to what a number counted, not how the campaign performed. Fixing the definitions is cheaper than fixing the relationship afterwards.
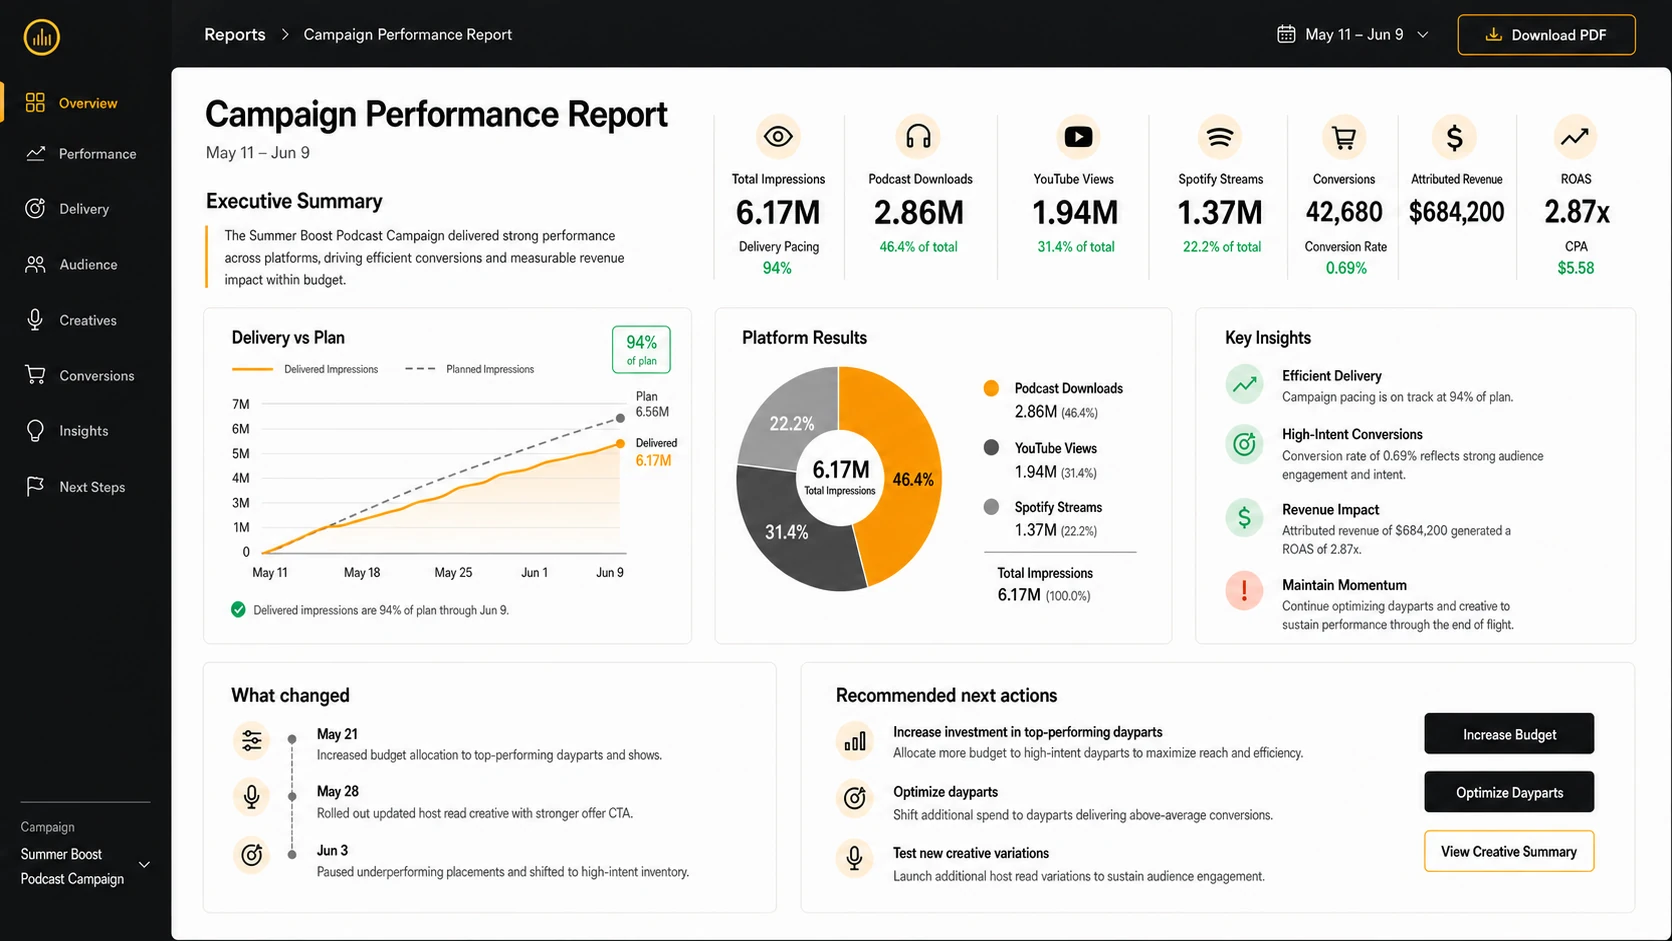
Illustrative example using fictional data. Report layouts and metrics are customized for each client. No client data is shown.
More metrics is not more clarity
The instinct when a client seems unconvinced is to add another chart. It almost never works, because the problem is rarely a missing number. It is that the numbers already present do not obviously relate to each other, so the client cannot tell which one to believe.
A report earns trust by being reconcilable. If a reader can follow how the total became the platform breakdown, and how the platform breakdown became the outcome, they will accept a modest result. If they cannot, they will question a good one.
Three layers, in this order
Every metric in a podcast campaign report belongs to one of three layers, and presenting them out of order is what creates most of the confusion.
Layer one: delivery
Did the campaign run as sold? Contracted versus delivered, pacing against the flight, remaining inventory, and any exception that affects the answer. This layer settles the invoice.
Layer two: performance
What did the audience do? Consumption, reach and engagement, kept inside the platform context where each figure was measured.
Layer three: commercial outcome
What did it produce? Conversions, attributed revenue, cost per acquisition, return on ad spend.
Reports that open with layer three feel like advocacy. Opening with delivery answers the question the client has not asked out loud yet, which is whether they received what they paid for. Everything after that lands better.
Downloads and impressions are not the same thing
This is the most common source of an awkward call. A download is a request for the episode file. An impression is a request for a specific ad inside it. Under dynamic insertion the two diverge by design, because not every listener receives the same ad, and a host-read endorsement baked into the episode may generate no ad-server impression at all while reaching every single listener.
Neither number is wrong. Presenting them as interchangeable is. Label each one with what it counted, and never let a summary figure silently mix the two.
Reach, frequency and the double-counting trap
Impressions across a multi-show campaign are not people. The same listener may follow three shows in the same network and be counted three times, which is fine for inventory delivery and misleading if the client reads it as audience size.
If you cannot deduplicate across shows, say so rather than implying a reach figure the data does not support. Clients are far more tolerant of a stated limitation than of a number that later turns out to have been optimistic.
Attribution needs its model attached
Attributed conversions and revenue are the most valuable figures in the report and the most fragile. Their value depends entirely on a method the client usually cannot see: pixel-based, promo code, survey, or a mix; a window of seven days or thirty; last-touch or something more generous.
Change the window and the number changes without anything real having changed. So the model, the window and the source belong next to the figure, every time. A report that shows attributed revenue with no stated method is inviting a challenge it cannot win, because when asked "what does this count?", the honest answer is a shrug.
Cross-platform totals need a rule
Campaigns now run across podcast feeds, YouTube and Spotify at once, and each platform counts on its own terms. A YouTube view and a podcast download are not equivalent units, and stacking them into one impressive total produces a number that is technically a sum and practically a fiction.
Two workable options: report platform figures side by side without a combined total, or define an explicit combined metric and state its rule wherever it appears. What does not work is a total that exists because the spreadsheet could add the columns. This is one of the layers a client dashboard has to get right before it is worth building at all.
Metrics that usually earn their place
- Contracted versus delivered impressions, with pacing against the flight
- Downloads or views by show and by platform, labeled with source
- Placement mix, since a mid-roll and a pre-roll are not the same product
- Conversions with the attribution model and window stated
- Attributed revenue, CPA and ROAS where the commercial data supports them
- Exceptions, make-goods and their resolution status
- One short recommendation the client can act on
Metrics that usually cause arguments
- A blended cross-platform total with no stated rule
- Reach implied from impressions with no deduplication
- Engagement rates whose denominator is not defined
- Attributed revenue with no model or window
- Any figure that changes between the dashboard and the emailed report
That last one deserves particular attention. Two surfaces built by two processes will eventually disagree, and the day a client notices is the day every other number becomes suspect too. It is the strongest argument for treating dashboards and scheduled reports as outputs of a single reporting operation rather than separate deliverables.
Write the definitions down once
The practical fix is unglamorous: a short definitions page, agreed with the client at the start of the relationship, stating what each metric counts, which system it comes from and which window applies. It takes an hour. It ends most reporting disputes before they start, and it converts the ones that remain from arguments about trust into conversations about method.
Everything else in this note follows from that one document. Numbers do not build confidence. Numbers whose meaning is agreed in advance do.
Contents
Common questions
What is the difference between podcast downloads and impressions?
A download counts a request for the episode file. An impression counts a request for a specific ad within it. They differ because not everyone who downloads an episode receives the same ad, especially with dynamic insertion, so the two numbers should never be presented as interchangeable.
Which podcast metrics should a client report lead with?
Lead with delivery against what was contracted, because that is the question underneath the invoice. Performance and commercial outcome follow. A report that opens with a response metric invites the client to ask whether the campaign even ran in full.
Why do podcast numbers differ between platforms?
Different platforms apply different counting windows, deduplication rules and filtering of automated requests, and video platforms count a view on entirely different terms than a podcast host counts a download. The fix is to label each figure with its source and definition rather than force them to agree.
Should attributed revenue appear in a podcast report?
Yes, when the attribution method is stated alongside it. Attributed revenue without its model and window is the metric most likely to be challenged, and the challenge usually succeeds because nobody can explain what the number counted.